
Table of Contents
Warehouse KPIs give us a clear way to control cost, speed, accuracy and service quality inside a warehouse. Without them, teams often manage by noise: late orders, urgent emails, stock disputes and labour pressure. With them, we can see where time, money and errors enter the operation. That matters because modern warehouses face tighter delivery promises, higher labour costs and growing customer expectations.
Strong warehouse metrics also stop teams from chasing the wrong problem. A picking team may look slow because travel time is high. A dispatch team may look weak because receiving posted stock late. A stock issue may appear as a customer service problem when the real cause lies in poor inventory accuracy.
This guide explains the most useful warehouse KPIs, gives formulas, and shows benchmark examples for fulfilment, stock, labour, space and cost. We will focus on practical numbers, not vanity dashboards. The goal is simple: measure what improves decisions, then use those numbers to reduce waste and protect service.
What Are Warehouse KPIs?

Why warehouse KPIs matter
Warehouse KPIs are measurable indicators that show how well warehouse processes perform. They cover receiving, put-away, storage, picking, packing, dispatch, returns, labour and cost. The best warehouse KPIs connect daily activity to business outcomes. For example, order picking accuracy links directly to returns, refunds, customer trust and rework. Inventory accuracy links to stock availability, order fill rate and fewer expedited orders. APQC notes that higher inventory accuracy supports stronger logistics performance, including better fill rates and lower expedited order percentages.
Good KPIs also make performance fairer. They move the discussion away from opinion and towards evidence. A warehouse manager can show that pick accuracy fell from 99.5% to 98.7% after a layout change. A planning team can prove that cut-off pressure creates packing errors after 3 pm. That evidence helps teams fix systems, not blame people.
Difference between KPIs and warehouse metrics
Warehouse metrics are raw measurements. Warehouse KPIs are the selected metrics that matter most to the operation. A warehouse may track 60 data points, but only 10 should guide weekly management action. For example, total picks, labour hours and pallet moves are useful warehouse metrics. However, cost per order, order cycle time and inventory accuracy are stronger management KPIs because they show performance against goals.
A useful KPI must meet four tests. It must have a clear formula. It must have a named owner. It must update often enough to support action. It must link to cost, speed, accuracy or customer service. When a metric fails these tests, it becomes dashboard clutter. We need fewer numbers with stronger meaning.
Core Warehouse KPI Categories

The five KPI groups every warehouse should track
Strong KPI systems usually group warehouse KPIs into five areas: cost, speed, accuracy, productivity and space. These categories help leaders see the full operation. Cost KPIs show whether the warehouse spends too much to process each order. Speed KPIs show whether goods move fast enough through receiving, picking and dispatch. Accuracy KPIs show whether orders and stock records match reality.
Productivity KPIs show how much work the team completes per labour hour. Space KPIs show whether locations, racking and floor areas support throughput. The groups work together. A warehouse can improve speed by adding labour, but the cost per order may rise. It can improve space use by filling every bin, but picking speed may drop. Balanced warehouse KPIs stop teams from improving one number while damaging another.
Recommended KPI dashboard structure
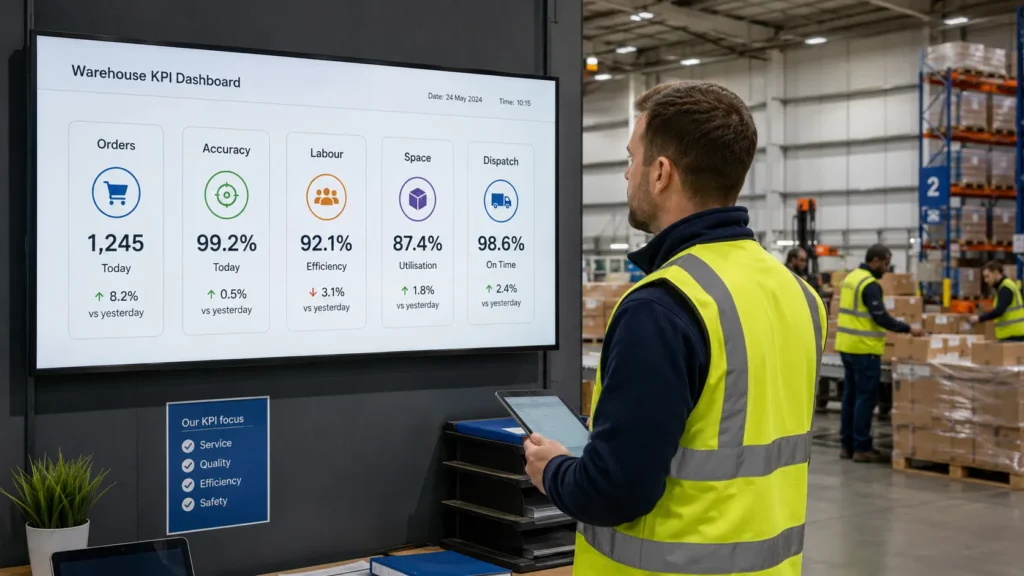
A practical dashboard should show daily, weekly and monthly views. Daily KPIs should focus on control: orders shipped, late orders, pick accuracy, labour hours and backlog. Weekly KPIs should focus on process health: inventory accuracy, dock-to-stock time, returns rate and productivity. Monthly KPIs should focus on cost and capacity: cost per order, stock turnover, space utilisation and carrying cost.
| KPI Group | Example KPI | Formula | Typical Review Cycle | Main Owner |
|---|---|---|---|---|
| Cost | Cost per order | Total warehouse cost ÷ Orders shipped | Weekly / Monthly | Operations Manager |
| Speed | Order cycle time | Dispatch time − Order received time | Daily / Weekly | Fulfilment Lead |
| Accuracy | Inventory accuracy | Correct counts ÷ Total counts × 100 | Weekly / Monthly | Stock Control |
| Productivity | Picks per labour hour | Total picks ÷ Labour hours | Daily | Shift Manager |
| Space | Space utilisation | Used storage space ÷ Total storage space × 100 | Monthly | Warehouse Manager |
| Service | On-time dispatch | Orders dispatched on time ÷ Orders shipped × 100 | Daily | Dispatch Lead |
This structure keeps accountability clear. Each KPI needs one owner, one formula and one improvement route.
Order Accuracy KPI

Formula and benchmark example
Order accuracy measures the percentage of orders shipped without errors. It is one of the most important warehouse KPIs because it directly affects returns, complaints and customer loyalty. The formula is simple: Order Accuracy % = Error-Free Orders ÷ Total Orders Shipped × 100. If a warehouse ships 20,000 orders and 19,860 have no errors, order accuracy equals 99.30%.
A practical benchmark target is 99% or higher for most fulfilment operations. Some published guidance places good order accuracy at 99%+, while manual picking accuracy may sit around 97% in cost-pressured operations. Deposco reported that each error can cost £20 to £60 to correct, depending on returns, rework and service handling.
How to improve order accuracy
Order accuracy improves when teams reduce decisions at the pick face. Clear slot labels, barcode scanning, location control and pack validation all help. The best method depends on the error type. Wrong item errors often point to poor location discipline. Wrong quantity errors often point to counting units, cases and packs incorrectly. Wrong paperwork errors often sit in packing or carrier integration.
Track errors by reason code, not only by percentage. Useful reason codes include wrong SKU, wrong quantity, missing item, damaged item, wrong label and wrong carrier. A warehouse with 99.2% accuracy may look good. However, if 70% of errors come from one product group, the team has a clear fix. Strong warehouse KPIs always lead to action.
Inventory Accuracy KPI
Formula and stock control value
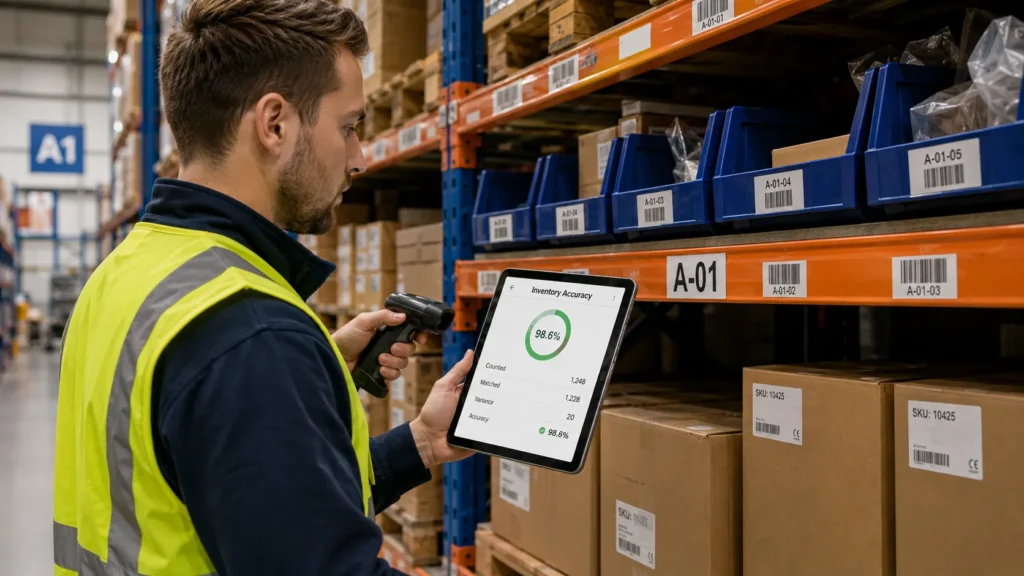
Inventory accuracy measures how closely system stock matches physical stock. The formula is: Inventory Accuracy % = Correctly Counted Stock Records ÷ Total Stock Records Counted × 100. Another method uses units: Accurate Units ÷ Total Units Counted × 100. If a cycle count checks 1,000 SKU-location records and 972 match, inventory accuracy equals 97.20%.
High inventory accuracy matters because every warehouse process depends on stock trust. Low accuracy causes failed picks, substitutions, short shipments, urgent stock checks and customer cancellations. APQC states that inventory accuracy affects wider logistics performance, including fill rate, expedited orders and carrying cost as a percentage of inventory value.
Inventory accuracy example
Assume a warehouse holds 8,000 active SKU-location records. The stock team cycle counts 800 records each week. In one week, 776 records match the WMS exactly. The inventory accuracy rate is 97.00%. If the target is 99.00%, the gap is 2 percentage points. That sounds small, but it means 16 extra inaccurate records per 800 counted.
The best improvement route is not a full annual stocktake alone. Use cycle counting by risk. Count fast movers weekly, medium movers monthly and slow movers quarterly. Add immediate counts after stock adjustments, returns and location moves. Inventory accuracy improves fastest when counting connects to root causes, not just variance reports.
Order Fill Rate KPI
Formula and customer impact
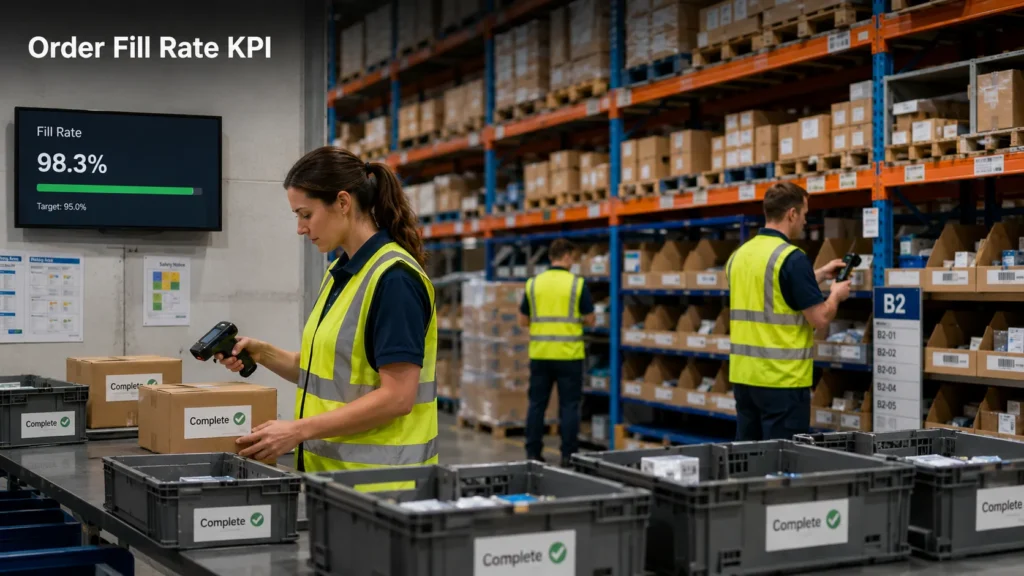
Order fill rate shows the percentage of customer demand fulfilled from available stock. The formula is: Order Fill Rate % = Orders Filled Complete ÷ Total Orders × 100. Some warehouses use line fill rate instead: Lines Filled Complete ÷ Total Order Lines × 100. Line fill rate is often better for B2B warehouses because one missed line can delay an entire customer order.
Fill rate connects fulfilment KPIs with inventory accuracy. A warehouse may have strong picking speed but poor fill rate because stock records are wrong. It may also suffer from supplier delays, poor replenishment or bad demand planning. That is why fill rate should sit beside inventory accuracy, not apart from it. Together, they show whether the warehouse can promise and deliver what customers ordered.
How to diagnose low fill rate
Start by separating “true stockouts” from “system stock errors”. A true stockout means the warehouse had no physical stock. A system stock error means the WMS showed stock, but pickers could not find it. The fixes are different. True stockouts need better forecasting, purchasing or safety stock rules. System errors need stronger receiving, put-away, movement and counting discipline.
Track fill rate by SKU, supplier, product category and order channel. E-commerce orders may suffer from fast-moving item shortages. Wholesale orders may suffer from case quantity issues. Spare parts warehouses may suffer from slow-moving stock location errors. Strong warehouse metrics show where the fill-rate problem begins.
Perfect Order Rate KPI

The formula and why it is powerful
Perfect order rate measures orders completed without any failure. It combines accuracy, completeness, documentation, damage and timing. The formula is: Perfect Order Rate % = Perfect Orders ÷ Total Orders × 100. A perfect order usually meets five conditions: correct item, correct quantity, correct paperwork, undamaged goods and on-time dispatch.
This is one of the strongest warehouse KPIs because it reflects the customer experience. A warehouse may achieve 99% pick accuracy and 98% on-time dispatch, yet the combined perfect order rate can be lower. For example, if 10,000 orders ship and 9,420 meet every perfect order condition, the perfect order rate is 94.20%. That figure shows the real service level more clearly than isolated measures.
Perfect order example
Consider a warehouse shipping 50,000 orders per month. It records 400 late orders, 250 picking errors, 180 damage claims and 120 paperwork issues. Some issues overlap, so the warehouse identifies 49,150 perfect orders. The perfect order rate is 98.30%. If the business target is 99.00%, the gap equals 350 additional perfect orders per month.
Improvement starts with defect mapping. Rank failure reasons by cost and frequency. A low-frequency damage issue may cost more than a high-frequency paperwork issue. A late dispatch issue may damage key accounts more than a small picking error. Perfect order rate helps leaders choose fixes that protect service and margin together.
Order Cycle Time KPI
Formula and speed control
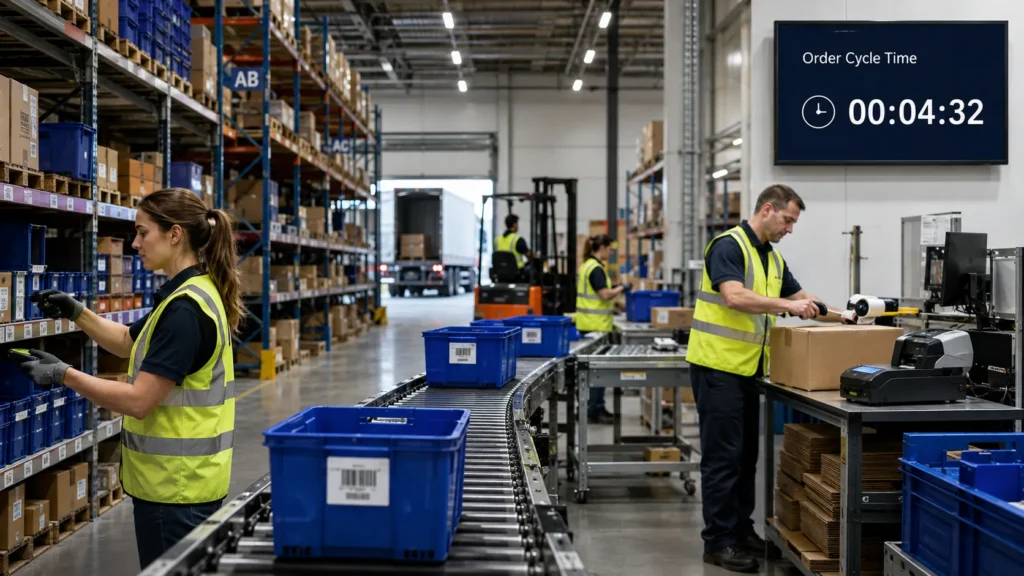
Order cycle time measures the time from order receipt to dispatch, or receipt to delivery. In warehouse operations, the most useful version is often from order receipt to dispatch. The formula is: Order Cycle Time = Dispatch Time − Order Received Time. If an order enters the WMS at 10:15 and leaves dispatch at 15:45, the warehouse order cycle time is 5 hours and 30 minutes.
APQC defines customer order cycle time as the time between order placement and delivery. It also tracks cycle time from customer order receipt to completing order preparation, which helps measure logistics and warehousing process duration.
How to use order cycle time
Order cycle time should be measured by channel, order size and cut-off window. A single average can hide serious issues. Same-day e-commerce orders behave differently from palletised trade orders. A one-line order behaves differently from a 45-line order. We should compare similar work with similar work.
Use percentiles as well as averages. The average may show 4 hours, but the 90th percentile may show 11 hours. That means one in ten orders moves much more slowly. These slow orders often reveal missing stock, replenishment delays, packing bottlenecks or carrier collection pressure. Good warehouse KPIs show variation, not only averages.
Dock-to-Stock Time KPI
Formula and receiving performance
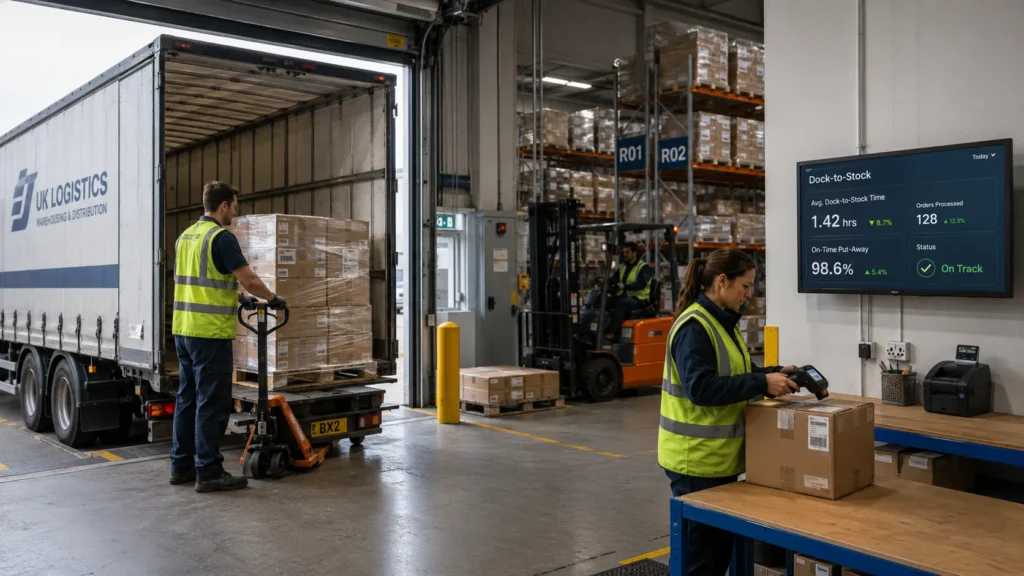
Dock-to-stock time measures how long it takes inbound goods to become available for sale, picking or production. The formula is: Dock-to-Stock Time = Stock Available Time − Goods Arrival Time. If a lorry arrives at 08:00 and goods become pickable at 13:30, dock-to-stock time is 5 hours 30 minutes.
This KPI matters because receiving delays create hidden stockouts. The stock may be inside the building, but unavailable to pickers. Sales teams may promise late. Buyers may reorder goods already received. Pickers may search for stock still waiting in staging. Dock-to-stock time connects inbound discipline with outbound service.
How to reduce dock-to-stock time
Start by splitting the process into arrival, unloading, checking, quality inspection, booking-in and put-away. Each step needs a timestamp. Without timestamps, teams argue about where the delay sits. With timestamps, the answer becomes visible. For example, goods may be unloaded within 30 minutes but wait 4 hours for booking-in.
Set different targets by inbound type. A pre-advised pallet from a trusted supplier should move faster than mixed cartons needing full inspection. Use ASN compliance as a supporting metric. If suppliers send accurate advance shipping notices, receiving teams can plan labour, labels and locations before arrival. This reduces manual checks and shortens dock-to-stock time.
Picking Productivity KPI

Formula and practical benchmark context
Picking productivity measures output per labour hour. Common formulas include: Picks per Hour = Total Picks ÷ Picking Labour Hours and Order Lines per Hour = Lines Picked ÷ Picking Labour Hours. If a team completes 9,600 picks across 120 labour hours, productivity equals 80 picks per labour hour.
Productivity benchmarks vary widely by product, layout and picking method. Deposco reported pick rates of 70 to 120 items per hour in the UK warehouse labour analysis, with order pickers spending 57% of their time travelling and walking. It also reported labour as 60% to 65% of total fulfilment costs, equal to £2.10 to £3.90 per unit in its example.
How to improve picking productivity
Travel reduction usually gives the fastest gain. Place fast movers near dispatch, reduce dead walking, and use batch or zone picking where order profiles support it. A picker who spends most of the shift walking cannot reach high productivity, even with strong effort. Layout often beats motivation.
Measure productivity by pick type. Eaches, cases and pallets should not share one target. A picker handling fragile cases cannot match a case picker using powered equipment. Productivity KPIs must be fair and operationally sensible. Track accuracy beside speed. A team that increases picks per hour while errors double has not improved performance.
Labour Cost per Order KPI

Formula and cost control
Labour cost per order shows how much warehouse labour goes into each shipped order. The formula is: Labour Cost per Order = Total Warehouse Labour Cost ÷ Orders Shipped. If the weekly labour cost is £42,000 and the warehouse ships 21,000 orders, the labour cost per order is £2.00.
This KPI helps managers understand whether volume, process design or staffing patterns drive cost. A low-volume Monday may show high labour cost per order because fixed labour remains in place. A busy Friday may show a lower cost per order, but overtime may reduce the benefit. We need the trend by day, shift and channel.
How to use labour cost carefully
Do not use labour cost per order alone. It can encourage under-staffing, rushed work and poor accuracy. Pair it with order accuracy, on-time dispatch and backlog. A warehouse that cuts labour cost from £2.00 to £1.70 but increases errors from 0.7% to 1.6% may lose money after returns and rework.
Use engineered standards where possible. Time studies can show expected minutes for receiving, replenishment, picking, packing and dispatch. Then compare planned labour hours with actual labour hours. This creates better conversations. Instead of saying “labour is too high”, managers can say “packing used 18% more hours than standard because carton selection changed”.
Cost per Order KPI
Formula and full warehouse cost
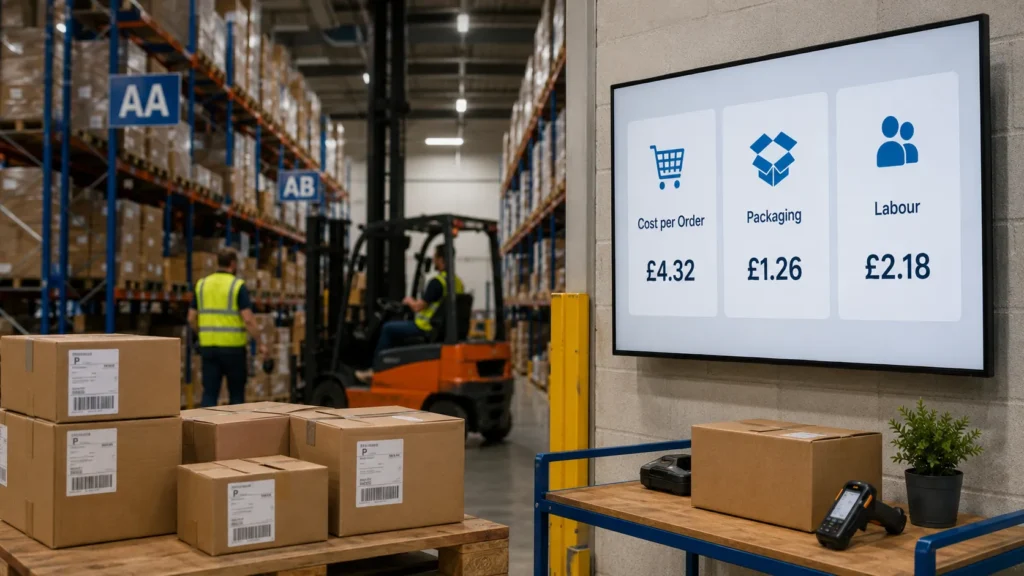
Cost per order measures the full warehouse operating cost for every order shipped. The formula is: Cost per Order = Total Warehouse Operating Cost ÷ Orders Shipped. Operating cost should include labour, rent, utilities, equipment, packaging, systems, maintenance, waste, temporary staff and warehouse overheads.
This KPI gives leaders a commercial view of warehouse performance. A warehouse may ship more units, but if the cost per order rises, something is wrong. Common causes include overtime, poor slotting, inefficient packing, excessive touches, stock errors and low automation use. Cost per order also helps compare order channels. Marketplace orders, wholesale orders and direct website orders often carry different handling costs.
Example cost per order model
Assume a warehouse ships 80,000 orders per month. Monthly warehouse cost includes £145,000 labour, £42,000 rent, £18,000 utilities, £24,000 packaging, £16,000 equipment, £9,000 systems and £11,000 other overheads. Total cost equals £265,000. Cost per order equals £3.31.
If picking errors cost £35 each and the warehouse makes 640 errors, the error cost adds £22,400. When included, the adjusted cost per order rises to £3.59. This shows why accuracy matters financially. The cheapest warehouse is not the one with the lowest labour cost. It is the one that ships clean orders with controlled total cost.
Inventory Turnover KPI

Formula and cash flow value
Inventory turnover shows how often stock sells or moves through the warehouse during a period. The formula is: Inventory Turnover = Cost of Goods Sold ÷ Average Inventory Value. If the annual cost of goods sold is £12,000,000 and the average inventory value is £2,000,000, the inventory turnover equals 6.0 times per year.
This KPI matters because stock ties up cash, space and handling capacity. Low turnover can indicate overstocking, slow-moving items or poor demand planning. Very high turnover can also create problems if it leads to stockouts and urgent replenishment. Inventory turnover must be read with fill rate and inventory accuracy.
How warehouses can act on turnover
Warehouse teams cannot control all demand, but they can control visibility. Ageing stock reports, dead stock zones and slow-mover reviews help buyers and planners make better decisions. A stock item that turns once per year should not occupy a prime pick face. A fast mover that turns 24 times per year should not sit in a remote location.
Segment stock with ABC analysis. A-items have high movement or value and need frequent counts. B-items need regular control. C-items need low-cost storage and fewer touches. This supports better warehouse metrics because each product group receives the right level of attention.
Stock Carrying Cost KPI

The formula and hidden warehouse cost
Stock carrying cost measures the annual cost of holding inventory. The formula is: Carrying Cost % = Total Inventory Holding Cost ÷ Average Inventory Value × 100. Holding costs can include storage, insurance, shrinkage, obsolescence, damage, financing, handling and systems. If holding cost is £320,000 and the average inventory value is £2,000,000, the carrying cost equals 16.00%.
This KPI is important because warehouses often hide the true cost of excess stock. More stock needs more space, more counting, more equipment and more handling. It also increases the risk of damage and expiry. Carrying cost connects warehouse operations with buying decisions.
How to reduce carrying costs
Start with stock ageing. Report stock by 0–30 days, 31–60 days, 61–90 days, 91–180 days and over 180 days. Then review high-value slow movers first. A £60,000 slow-moving product line deserves more attention than a £300 line, even if both move slowly.
Improve storage density without damaging pick speed. Deep storage may suit reserve pallets, but not fast-moving, each-pick products. Use warehouse KPIs to balance cost and flow. High storage utilisation can reduce rent pressure, but poor access can increase labour costs. The right answer depends on the total cost, not one metric.
Space Utilisation KPI

Formula and benchmark example
Space utilisation shows how much storage capacity is in use. The formula is: Space Utilisation % = Used Storage Capacity ÷ Total Storage Capacity × 100. Capacity can be measured by pallet positions, bin locations, cubic metres or square metres. If a warehouse uses 6,800 pallet positions out of 10,000, space utilisation is 68.00%.
One 2026 warehouse KPI article cites the 2025 WERC DC Measures Report as showing average warehouse order picking accuracy at 99.49% and average space utilisation at 68%. These figures are useful benchmark examples, although every warehouse should compare against its own layout, product mix and service promise.
How to read space utilisation
High space utilisation is not always good. A warehouse at 95% capacity may struggle to receive, replenish and pick efficiently. Congestion increases travel time, damage and safety risk. A warehouse at 55% may carry too much space, but it may also need seasonal capacity. The right target depends on volatility.
Track storage utilisation separately from floor congestion. A warehouse can have 68% pallet position use but blocked aisles because goods wait in staging. That means the storage plan, receiving schedule, or put-away process needs work. Strong warehouse metrics show usable capacity, not just theoretical space.
On-Time Dispatch KPI

Formula and service control
On-time dispatch measures orders shipped by the promised warehouse cut-off. The formula is: On-Time Dispatch % = Orders Dispatched On Time ÷ Orders Due for Dispatch × 100. If 14,700 out of 15,000 due orders leave on time, on-time dispatch equals 98.00%.
This is one of the most visible fulfilment KPIs. Customers may not see picking speed, but they see late delivery. Carriers also depend on warehouse timing. Missed carrier collections can add a full day to delivery, even when picking is finished only 15 minutes late. That makes dispatch timing a critical control point.
How to improve on-time dispatch
Measure backlog by hour. A daily total tells us what happened, but an hourly curve shows when pressure built. If orders flood packing between 14:00 and 16:00, the problem may be late picking release, replenishment failure or poor wave planning. The fix may not sit in dispatch.
Use cut-off discipline. Separate same-day, next-day and economy orders. Protect carrier-specific deadlines. Assign clear escalation rules for orders at risk. On-time dispatch improves when teams see risk early, not when they discover late orders after collection.
Returns Rate KPI

Formula and quality impact
Returns rate measures the percentage of shipped orders returned. The formula is: Returns Rate % = Returned Orders ÷ Shipped Orders × 100. If 1,200 orders are returned from 40,000 shipped orders, returns rate equals 3.00%. For warehouse management, the reason code matters more than the headline rate.
Some returns come from customer choice, especially in fashion and e-commerce. Others come from warehouse failure, including wrong items, damage, missing parts or poor packaging. Warehouse-controlled returns should sit on the KPI dashboard. They show quality costs that may not appear in pick accuracy reports.
How to use returns data
Separate commercial returns from operational returns. Commercial returns include unwanted items, size choices and changed minds. Operational returns include wrong SKU, wrong quantity, damaged product, late delivery and poor documentation. Warehouse teams should own the operational section.
Track return cost per reason. A damaged bulky item may cost more than a small wrong item. Use photos, carrier scans and pack station data to prove causes. Returns rate becomes powerful when it supports packaging changes, handling training and supplier quality action.
Damage Rate KPI

Formula and prevention
Damage rate measures the percentage of units, lines or orders damaged during warehouse handling. The formula is: Damage Rate % = Damaged Units ÷ Units Handled × 100. If the warehouse handles 500,000 units and damages 1,250, the damage rate equals 0.25%.
Damage costs more than the product value. It creates admin, disposal, rework, customer contact, replacement shipping and stock adjustments. Damage can also hide inside inventory accuracy issues when teams write off stock without proper reason codes. Good warehouse KPIs make damage visible by area, product and handling method.
How to reduce damage
Map damage by process step. Receiving damage may indicate supplier packaging problems. Put-away damage may point to MHE handling. Picking damage may point to poor bin design. Packing damage may point to wrong carton sizes or weak void fill. Dispatch damage may point to pallet build quality.
Use exact damage categories. Avoid vague codes like “warehouse damage”. Better codes include crush damage, moisture damage, dropped item, forklift strike, poor pallet wrap and pack failure. Clear coding turns damage from a cost into a fixable process.
Replenishment KPI

Formula and pick-face control
Replenishment success measures whether pick locations have stock when pickers need it. A useful formula is: Replenishment Availability % = Picks Completed Without Replenishment Delay ÷ Total Picks × 100. Another option is: Emergency Replenishments ÷ Total Replenishments × 100. Emergency replenishments are a strong warning signal.
This KPI matters because pickers lose time when fast-moving locations run empty. The stock exists in reserve, but not where the picker needs it. That creates delays, skipped lines and urgent forklift moves. Replenishment is often the hidden link between inventory accuracy and picking productivity.
How to improve replenishment
Use minimum and maximum levels for pick faces. Set them by actual movement, not guesswork. A product picked 600 times per week needs different replenishment rules from a product picked 20 times. Review min-max levels every 4 weeks for fast movers and every 12 weeks for slower lines.
Track replenishment misses by SKU and shift. If the night shift leaves empty faces for the morning shift, the issue may be task timing. If one product group causes most misses, the issue may be the location size. Replenishment KPIs work best when tied to slotting and demand patterns.
Put-Away Accuracy KPI
Formula and process discipline
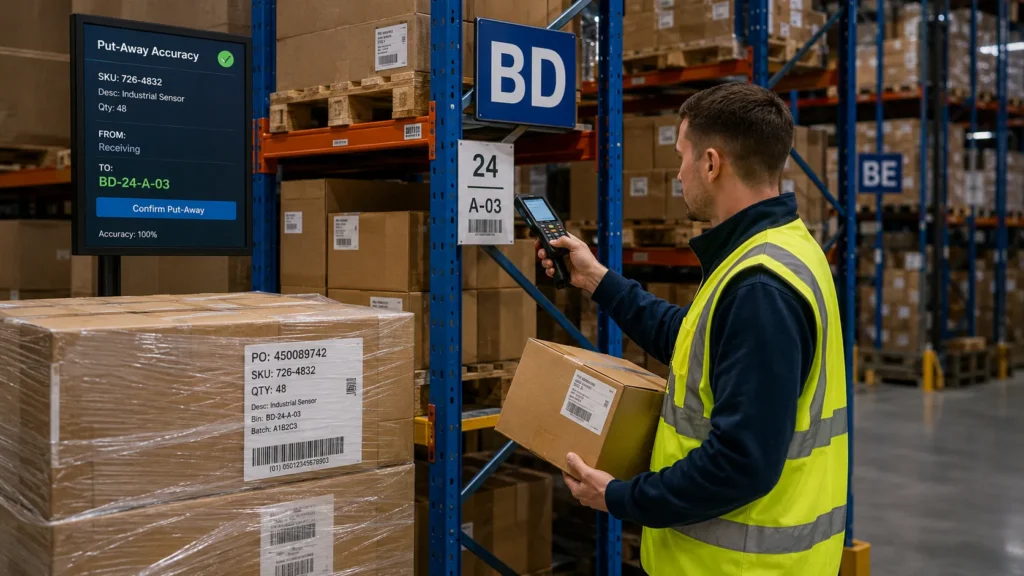
Put-away accuracy measures whether received goods are placed in the correct warehouse location. The formula is: Put-Away Accuracy % = Correct Put-Away Tasks ÷ Total Put-Away Tasks × 100. If 4,850 of 5,000 put-away tasks are correct, put-away accuracy equals 97.00%.
This KPI protects inventory accuracy. A product received correctly but placed in the wrong bin becomes a future picking problem. The WMS may show stock, but pickers cannot find it. That creates failed picks, stock adjustments and customer delays. Poor put-away accuracy spreads errors across the warehouse.
How to improve put-away accuracy
Use scan-to-location rules. The operator should scan the product, pallet or tote, then scan the final location. The WMS should block mismatched locations where rules apply. For manual operations, use clear location labels, aisle signs and put-away checklists.
Track first-time put-away success. If operators often move goods again after initial put-away, the warehouse has a location planning issue. Re-handling increases cost and delay. Good warehouse metrics capture extra touches because every touch adds labour and risk.
Safety KPI
Formula and operational link
Safety KPIs protect people and performance. Common measures include lost time injury frequency rate, near misses, MHE incidents, and unsafe acts. One formula is: Near Miss Closure % = Near Miss Actions Closed ÷ Near Miss Actions Raised × 100. Another is: MHE Incident Rate = MHE Incidents ÷ MHE Operating Hours × 1,000.
Safety belongs inside warehouse KPIs because unsafe warehouses become slow and expensive. Congested aisles, blocked fire exits, poor pallet stacking, and rushed picking all damage productivity. Safety data also identifies process stress. A rise in near misses during peak dispatch may show poor labour planning or layout pressure.
How to use safety KPIs
Track leading indicators, not only accidents. Accidents are lagging measures. Near misses, safety observations, housekeeping audits and training completion show risk earlier. A warehouse with 40 near misses reported, and 95% action closure may be healthier than one reporting no near misses at all.
Connect safety with space and speed metrics. If space utilisation rises from 75% to 92%, check incident trends, travel time and damage rate. High density without control can create risk. Balanced warehouse KPIs help leaders protect people while improving flow.
Warehouse KPI Benchmark Table
Example targets by process
Benchmarks must be used carefully. Product size, order profile, automation, labour model and service promise all change the number. A spare parts warehouse, a grocery warehouse and a fashion fulfilment centre cannot share identical targets. Still, benchmark examples help teams set starting points and challenge weak performance.
| KPI | Formula | Example Target | What Good Looks Like |
|---|---|---|---|
| Order accuracy | Error-free orders ÷ orders shipped × 100 | 99.00%+ | Wrong-item and wrong-quantity errors stay rare. |
| Picking accuracy | Correct picks ÷ total picks × 100 | 99.49% benchmark example | Scanning, slotting and validation control errors. |
| Inventory accuracy | Correct stock records ÷ counted records × 100 | 98.00%–99.50% | System stock matches physical stock. |
| On-time dispatch | Orders shipped on time ÷ due orders × 100 | 98.00%–99.50% | Carrier cut-offs are protected daily. |
| Dock-to-stock time | Available time − arrival time | Same day for standard inbound | Stock becomes sellable quickly. |
| Space utilisation | Used capacity ÷ total capacity × 100 | 68.00% benchmark example | Capacity supports flow without congestion. |
| Pick productivity | Picks ÷ labour hours | 70–120 items/hour example | Travel time stays controlled. |
| Labour cost per unit | Labour cost ÷ units shipped | £2.10–£3.90 example | Labour spend matches service and volume. |
| Error correction cost | Total error cost ÷ errors | £20–£60 example | Rework cost is visible and reduced. |
The 99.49% picking accuracy and 68% space utilisation figures were reported as WERC benchmark examples by Nexdriver. The 70–120 items per hour, £2.10–£3.90 labour cost per unit and £20–£60 error correction ranges were reported in Deposco’s UK labour cost analysis.
How to Build a Warehouse KPI Dashboard
Start with decisions, not charts
A good KPI dashboard starts with the decisions managers need to make. Daily shift leaders need backlog, labour, pick progress and late-order risk. Stock control needs variances, cycle count accuracy and adjustment reasons. Senior managers need cost per order, service level, capacity and trend performance. One dashboard cannot serve everyone equally.
Build three levels. Level 1 is the executive view with 8 to 12 KPIs. Level 2 is the operational view by process. Level 3 is the diagnostic view by SKU, location, shift, customer or supplier. This structure keeps warehouse KPIs clean. Leaders see the signal first, then drill into causes.
Use traffic lights with rules
Traffic lights help, but only when the rules are clear. Green means on target. Amber means at risk. Red means action needed. Each colour needs an agreed threshold. For example, on-time dispatch may be green at 99.00% or higher, amber from 97.50% to 98.99%, and red below 97.50%.
Avoid changing thresholds to make performance look better. That destroys trust. Review thresholds quarterly or after major process changes. Keep a change log. A KPI system only works when teams believe the numbers.
How to Improve Warehouse KPIs
Use root cause action
Warehouse KPIs do not improve because we measure them. They improve when teams act on root causes. Every weak KPI needs a simple action loop: measure, diagnose, fix, review and standardise. Without that loop, dashboards become reporting theatre.
For example, poor order accuracy may come from similar packaging, poor slotting or skipped scan steps. Each cause needs a different fix. Similar packaging may need product separation. Poor slotting may need location redesign. Skipped scanning may need system controls and supervisor checks. KPI improvement comes from an exact diagnosis.
Best improvement actions
Use these actions before buying complex tools:
- Review slotting every 4 weeks for fast movers.
- Count the A-class stock weekly and the C-class stock quarterly.
- Scan every pick, pack and dispatch confirmation.
- Track errors by reason code and product group.
- Separate urgent orders from standard orders.
- Measure travel time, not only pick output.
- Review labour cost per order by shift.
- Track late orders before the carrier cut-off.
- Hold a weekly KPI review with named owners.
- Close every KPI action with a date and result.
These steps make warehouse metrics operational. They turn performance data into better daily control.